Marokopa River
Catchment monitoring by Marokopa River Care commenced in May 2022.
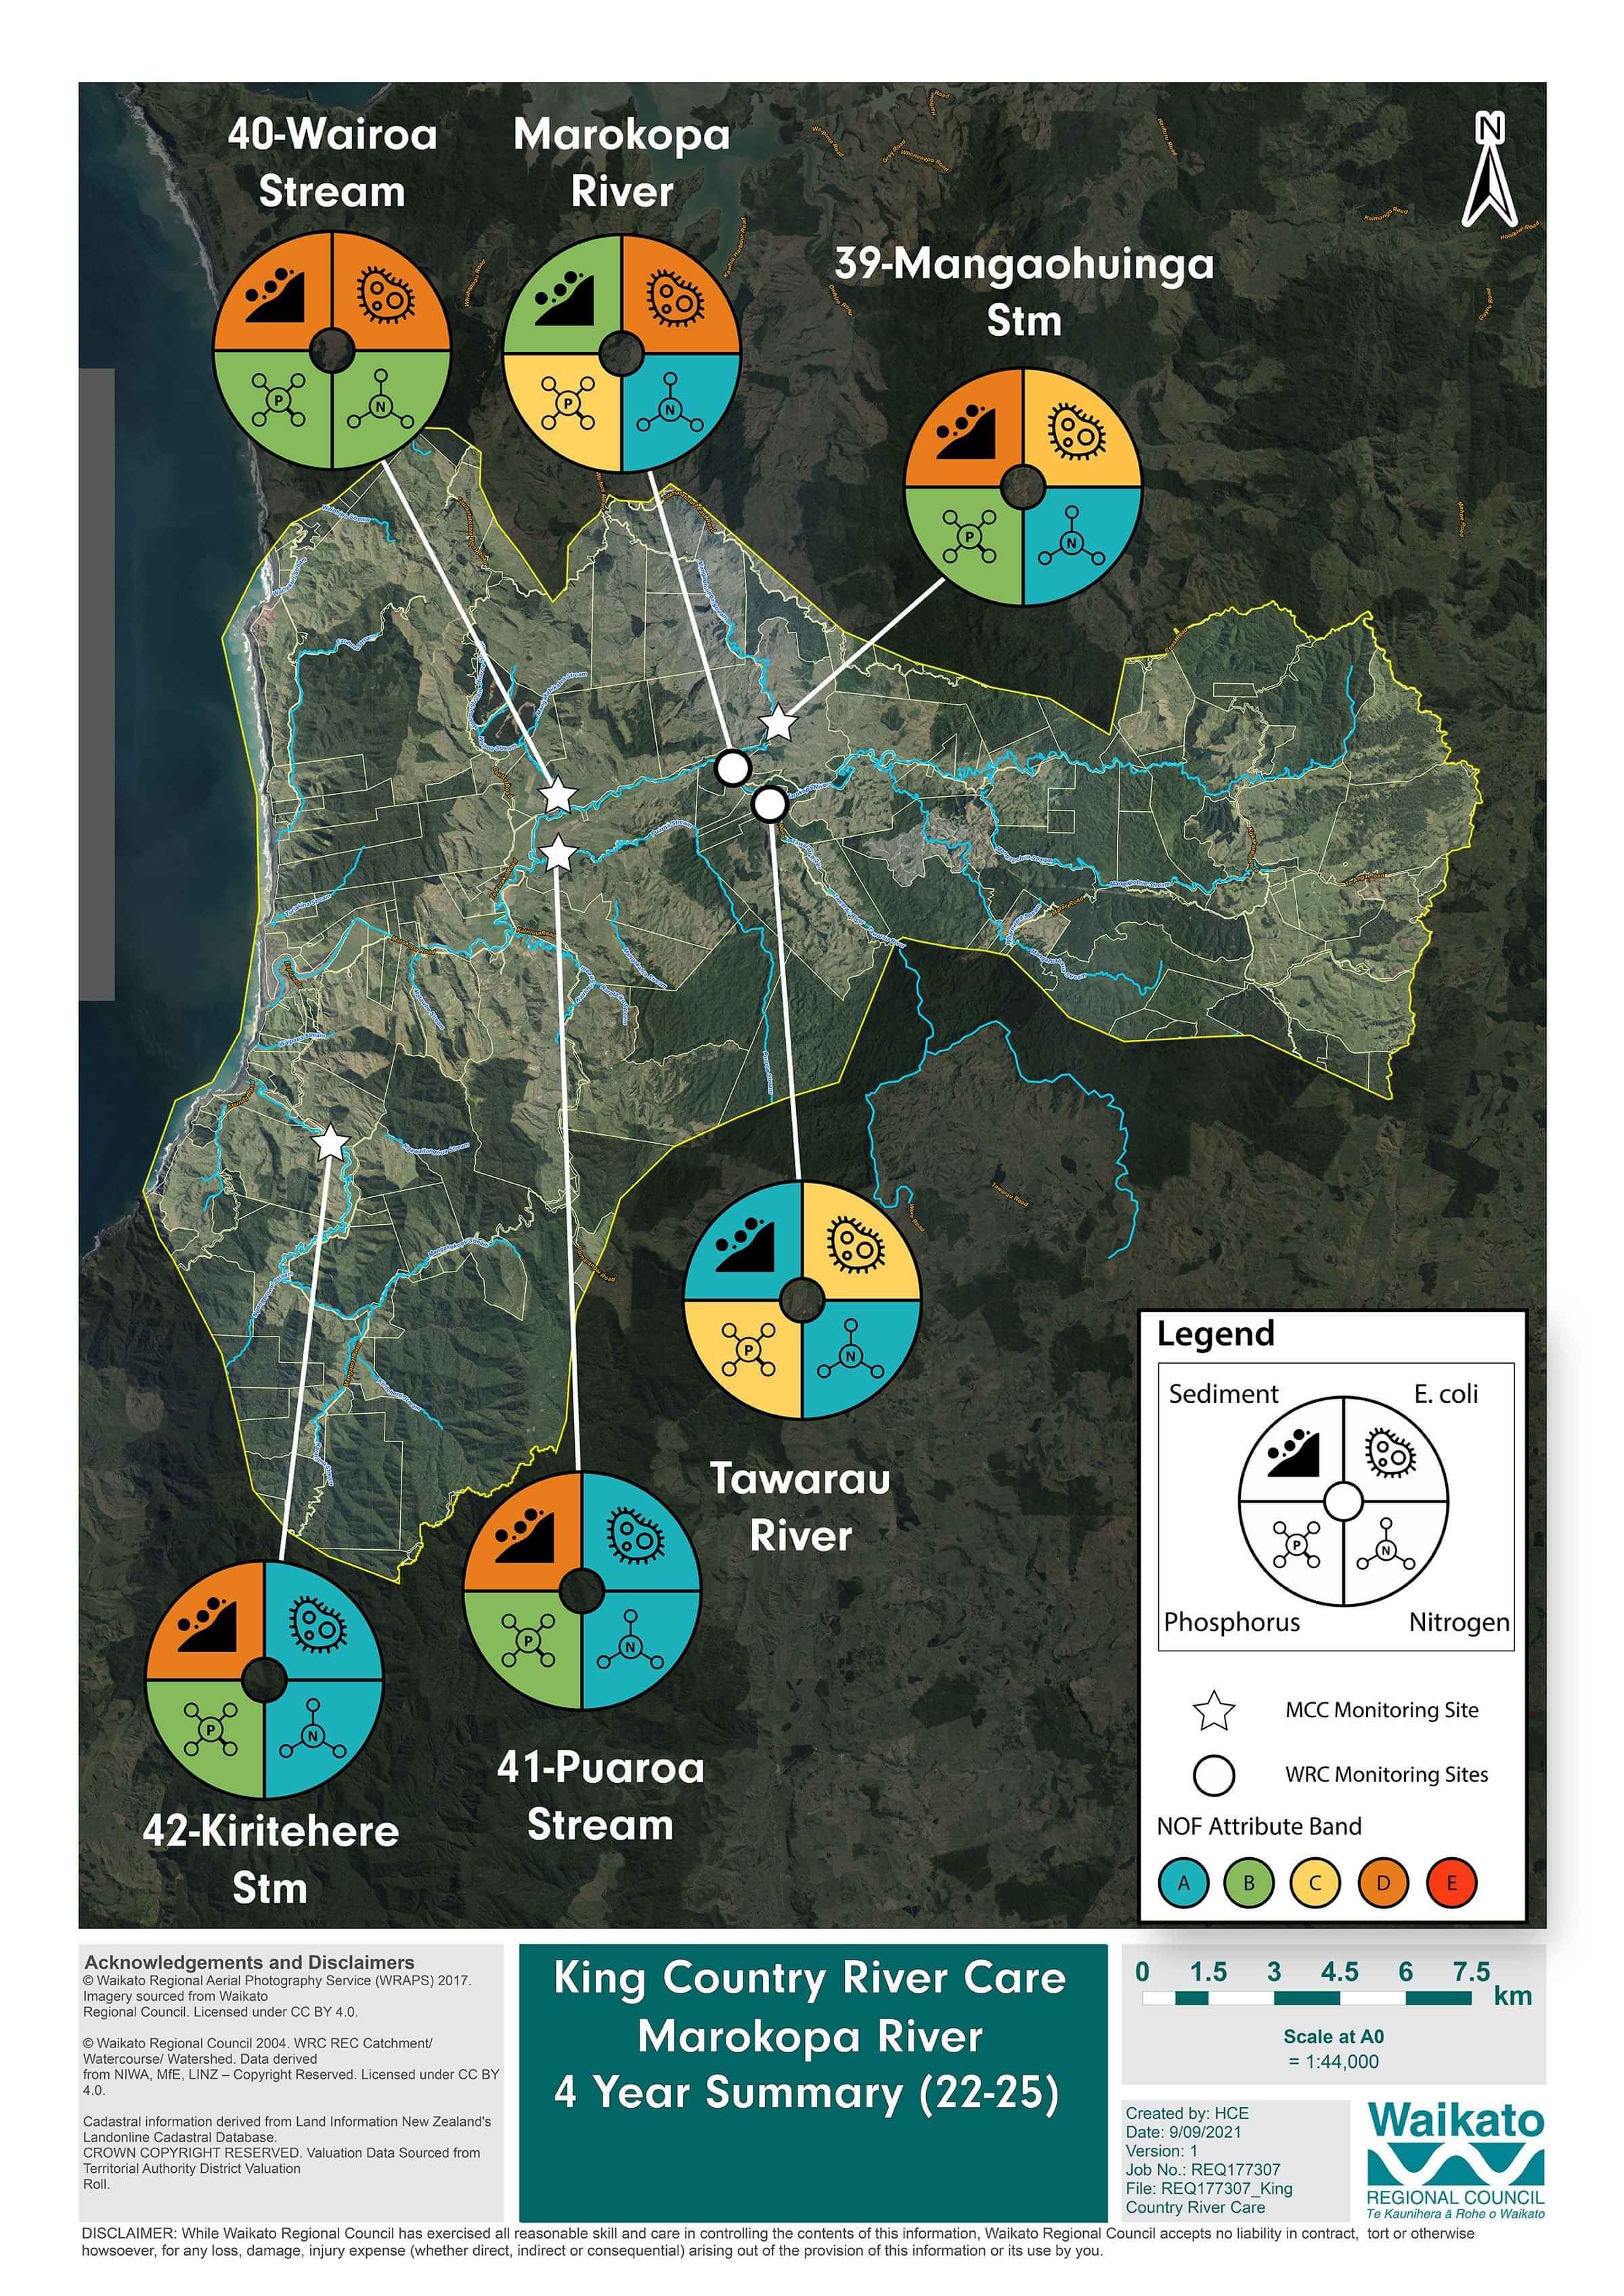
It covers four monitoring sites sampled on a quarterly basis. In addition, the Waikato Regional Council (WRC) has two monitoring sites, sampled monthly.
At the time the catchment group was formed a water quality baseline was calculated for Marokopa River using five years of monthly monitoring data (Jan 2016 – Dec 2020) from two sites at Marokopa River and Tawarau River.
The location of the monitoring sites for each sub-catchment are shown on the map to the right.
Key Resources Being Lost from the Land [2025]
Monitoring results show the key resources being lost from the Marokopa River catchment are E. coli and Sediment. E. coli represents a loss of organic matter and nutrients and is largely associated with animal manure in rural catchments. Sediment loss Sediment represents a loss of soil and nutrients.
E. coli was elevated in four sites, greatly exceeding recommended levels for swimming. However, E. coli was very low in Puaroa Stream and Kiritehere Stream. Suspended sediment was elevated in Wairoa Stream and Puaroa Stream and slightly elevated in Kiritehere Stream and Marokopa River at Speedies Road. This was reflected by a reduction in water clarity at these four sites. Dissolved reactive phosphorus concentrations were also slightly elevated at three sites, Mangaohuinga Stream, Marokopa River and Tawarau River.
The water quality dials on the following page summarise monitoring results for the six sites in the Marokopa catchment. The dial on the left shows the baseline for the catchment, covering 5 years of regional council monitoring at Marokopa River and Tawarau River, representing 116 individual samples. The dial on the right combines all data collected in the catchment in 2025, 38 samples. Arrows indicate either an increase or decrease in values compared to the sub-catchment baseline levels. An increase in water clarity is positive for river health while an increase in all other indicators may impair river health.
In 2025, nutrient indicators met national water quality limits while E. coli and water clarity/suspended sediment did not. Compared to the baseline – Water clarity was higher in 2025, the concentration of dissolved reactive phosphorus was slightly lower, but Nitrogen was greater.
Note:
Results have been assessed against the national freshwater attribute bands under the national policy statement for freshwater (NPS-FM 2020). The overall E. coli band is based on the following four measures, the percentage of samples exceeding 540 (CFU/100ml), the percentage of samples exceeding 260 (CFU/100ml), the median value and the 95th percentile (or upper 5% of E. coli concentrations). The overall nitrogen band is based on the following six measures, Nitrate Toxicity (median and 95th percentile), Ammonia Toxicity (median and maximum annual value) and Dissolved Inorganic Nitrogen (median and 95th percentile).
Full Report Available to Download
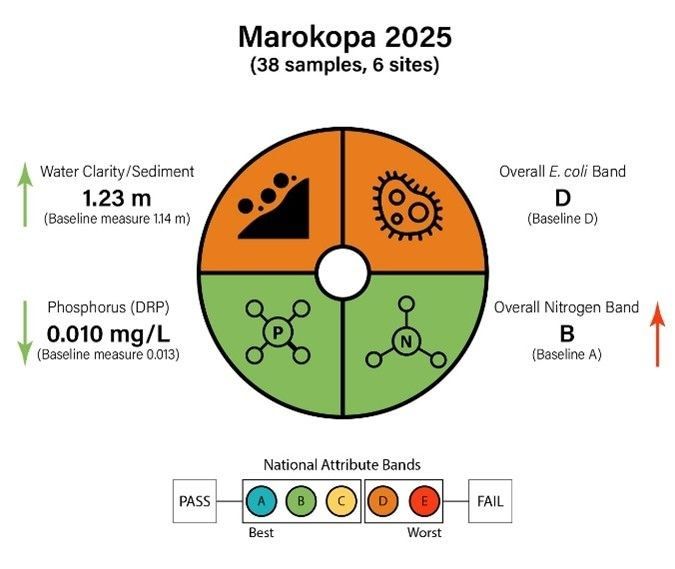
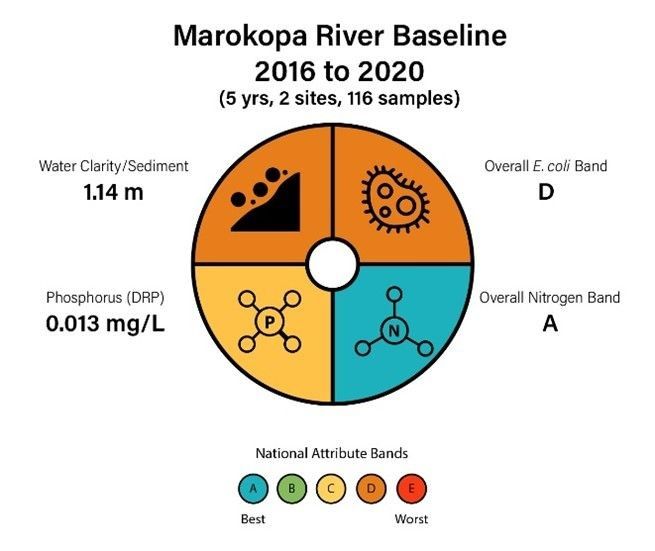
Water quality dials for the Marokopa catchment.
The bottom dial shows the sub-catchment baseline (2016-2020)
The top dial combines results collected in the 2025 monitoring period.
2025 Quarterly Summaries
February 2025
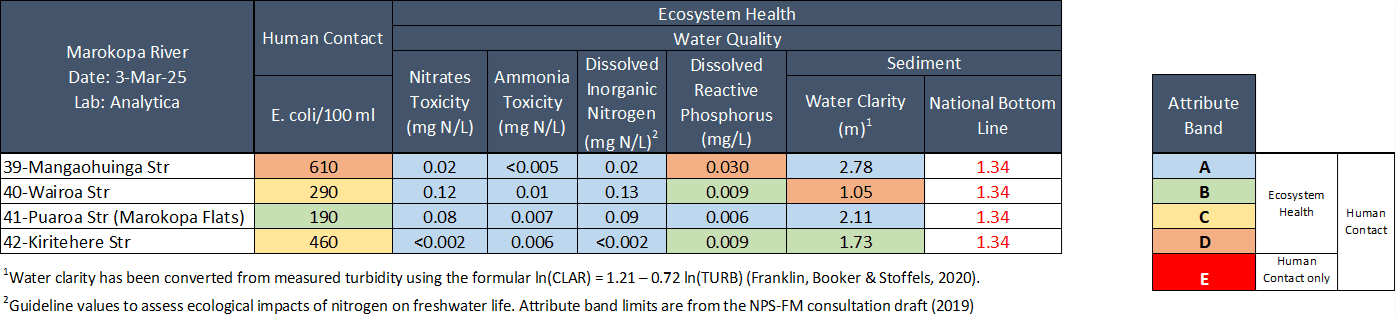
Water quality was Excellent in Puaroa stream (Site 41), Good in Kiritehere Stream (Site 42) and Fair in Mangaohuinga stream (Site 39) and Wairoa stream (Site 40).
E. coli concentrations were elevated in Mangaohuinga stream (610 cells per 100 mL) exceeding recommended health guidelines for swimming (540 cells per 100 mL). E. coli was slightly elevated in Wairoa stream (290 cells per 100 mL) and Kiritehere stream (460 cells per 100 mL). E. coli was low in Puaroa stream (190 cells per 100 mL).
Nitrogen:
Nitrate concentrations were low across all sites, falling well below ecological toxicity threshold (2.4 mg/L). Kiritehere stream had the lowest nitrate concentration (< 0.002 mg/L) and Wairoa stream had the highest concentration (0.12 mg/L).
Ammonia concentrations were low across all sites (≤ 0.01 mg/L).
Dissolved inorganic nitrogen (DIN) was very low across all sites (≤ 0.13 mg/L), falling well below the ecological impact threshold (0.5 mg/L).Phosphorus:
Dissolved reactive phosphorus (DRP) concentrations were low in three sites (≤ 0.009 mg/L). Mangaohuinga stream had an extremely high DRP concentration (0.030 mg/L), indicating a potential direct source upstream of the sample location.Suspended sediment/Water Clarity: Water clarity was excellent in Mangaohuinga stream (2.78 m) and Puaroa stream (2.11 m), good in Kiritehere stream (1.73 m) and poor in Wairoa stream (1.05 m), relative to the national bottom line (1.34 m).
The results in the table below have been graded according to the National Policy Statement for Freshwater Management (NPS-FM, 2020).
Collection date: 3rd March 2025
2025 Quarterly Summaries
May 2025
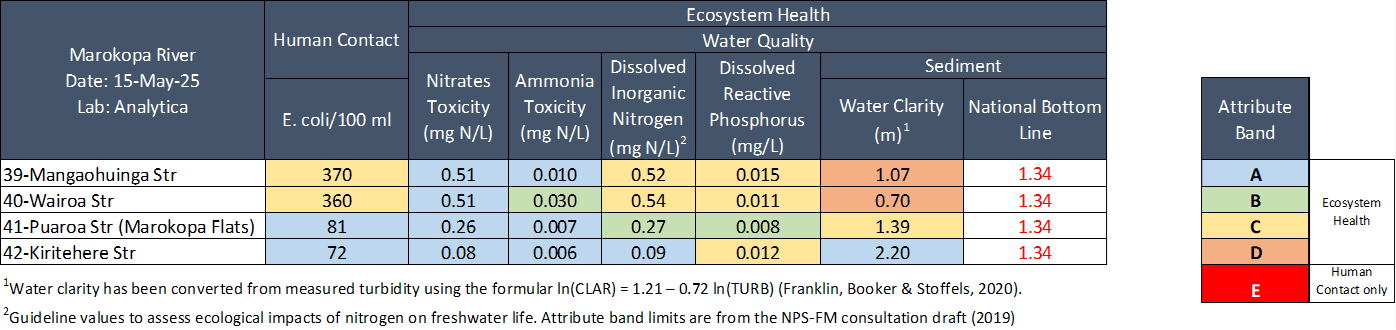
Water quality was Good in Puaroa stream (Site 41) and Kiritehere Stream (Site 42), Poor in Mangaohuinga stream (Site 39) and Wairoa stream (Site 40).
E. coli concentrations were very low in Kiritehere stream and Puaroa stream (≤ 81 cells per 100 mL) and slightly elevated in Mangaohuinga stream (370 cells per 100 mL) and Wairoa stream (360 cells per 100 mL). All sites fell within health guidelines for swimming (540 cells per 100 mL) and Kritehere stream and Puaroa stream met guidelines for livestock drinking water (< 100 cells per 100 mL).
Nitrogen:
Nitrate concentrations were low in Kiritehere stream and Puaroa stream (≤ 0.26 mg/L) and moderate in Mangaohuinga stream and Wairoa stream (0.52 – 0.54 mg/L). All sites fell well below the ecological toxicity threshold (2.4 mg/L).
Ammonia concentrations were low across all sites (≤ 0.03 mg/L).
Dissolved inorganic nitrogen (DIN) was very low in Kiritehere stream (0.09 mg/L), low in Puaroa stream (0.27 mg/L) and slightly elevated in Mangaohuinga stream and Wairoa stream (0.52 – 0.54 mg/L), exceeding the ecological impact threshold (0.5 mg/L).Phosphorus:
Dissolved reactive phosphorus (DRP) concentrations were low in Puaroa stream (0.008 mg/L) and slightly elevated in the other three sites (0.011 - 0.015 mg/L), which can contribute to problematic aquatic plant and algae growth.Suspended sediment/Water Clarity:
Water clarity was Excellent in Kiritehere stream (2.20 m), Fair in Puaroa stream (1.39 m) and Poor in Mangaohuinga stream (1.07 m) and Wairoa stream (0.70 m), relative to the national bottom line (1.34 m).
The results in the table below have been graded according to the National Policy Statement for Freshwater Management (NPS-FM, 2020).
Collection date: 15th May 2025
2025 Quarterly Summaries
August 2025
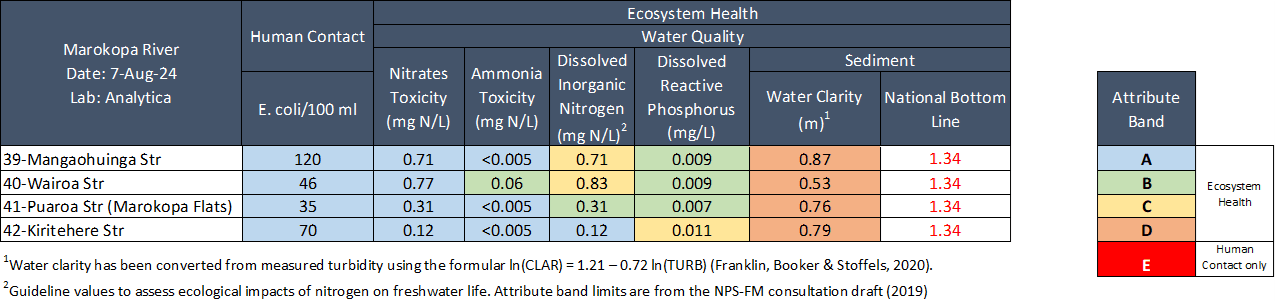
Water quality was Fair in all four sites – Mangaohuinga stream (Site 39), Wairoa stream (Site 40), Puaroa stream (Site 41) and Kiritehere Stream (Site 42).
E. coli concentrations were very low across all sites (≤ 120 cells per 100 mL), falling well within health guidelines for swimming (540 cells per 100 mL). Three sites also met guidelines for livestock drinking water (< 100 cells per 100 mL) [1].
Nitrogen:
Nitrate concentrations were low in Kiritehere stream and Puaroa stream (≤ 0.31 mg/L) and moderate in Mangaohuinga stream and Wairoa stream (0.71 & 0.77 mg/L). All sites fell well below the ecological toxicity threshold (2.4 mg/L).
Ammonia concentrations were low across all sites (≤ 0.06 mg/L).
Dissolved inorganic nitrogen (DIN) was very low in Kiritehere stream (0.12 mg/L), low in Puaroa stream (0.31 mg/L) and slightly elevated in Mangaohuinga stream and Wairoa stream (0.71 & 0.83 mg/L), exceeding the ecological impact threshold (0.5 mg/L).Phosphorus:
Dissolved reactive phosphorus (DRP) concentrations were low in three sites (0.009 mg/L) and slightly elevated in Kiritehere stream (0.011 mg/L), which can contribute to problematic aquatic plant and algae growth.Suspended sediment/Water Clarity was Poor across all sites (≤ 0.53 m), relative to the national bottom line (1.34 m).
The results in the table below have been graded according to the National Policy Statement for Freshwater Management (NPS-FM, 2020).
[1] Drinking water for livestock should contain < 100 cfu/100 mL (median value) of E. coli. Livestock Drinking Water Guidelines (2023), Australian & New Zealand Guidelines for Fresh & Marine Water Quality.
Sample Collection Day: 7th August 2025
2025 Quarterly Summaries
November 2025
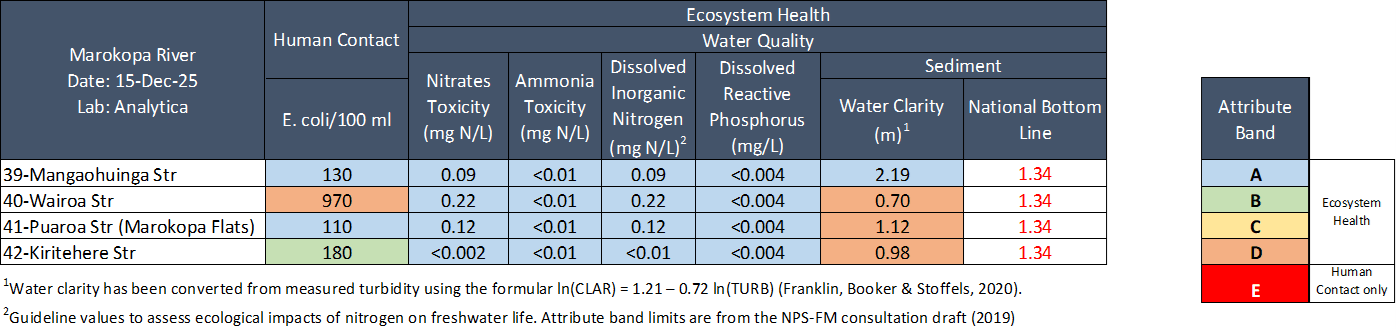
Water quality was Excellent in Mangaohuinga stream (Site 39) and Fair in Wairoa stream (Site 40), Puaroa stream (Site 41) and Kiritehere Stream (Site 42).
E. coli concentrations were low in three out of four sites (≤ 180 cells per 100 mL), falling well within health guidelines for swimming (540 cells per 100 mL). Concentrations were elevated in Wairoa stream (970 cells per 100 mL). No sites met guidelines for livestock drinking water (< 100 cells per 100 mL) [1].
Nitrogen: Nitrate concentrations were very low across all sites (≤ 0.22 mg/L), falling well below the ecological toxicity threshold (2.4 mg/L). Ammonia concentrations were very low across all sites (< 0.01 mg/L). Dissolved inorganic nitrogen (DIN) was also very low across all sites (≤ 0.22 mg/L), fall well below the ecological impact threshold (0.5 mg/L).
Phosphorus: Dissolved reactive phosphorus (DRP) concentrations were very low in three sites (< 0.004 mg/L).
Suspended sediment/Water Clarity was Excellent in Mangaohuinga stream (2.19 m) and Poor across all other sites (≤ 1.12 m), relative to the national bottom line (1.34 m).
The results in the table below have been graded according to the National Policy Statement for Freshwater Management (NPS-FM, 2020).
Sample Collection Day: 15th December 2025
Marokopa River
Data & Downloads
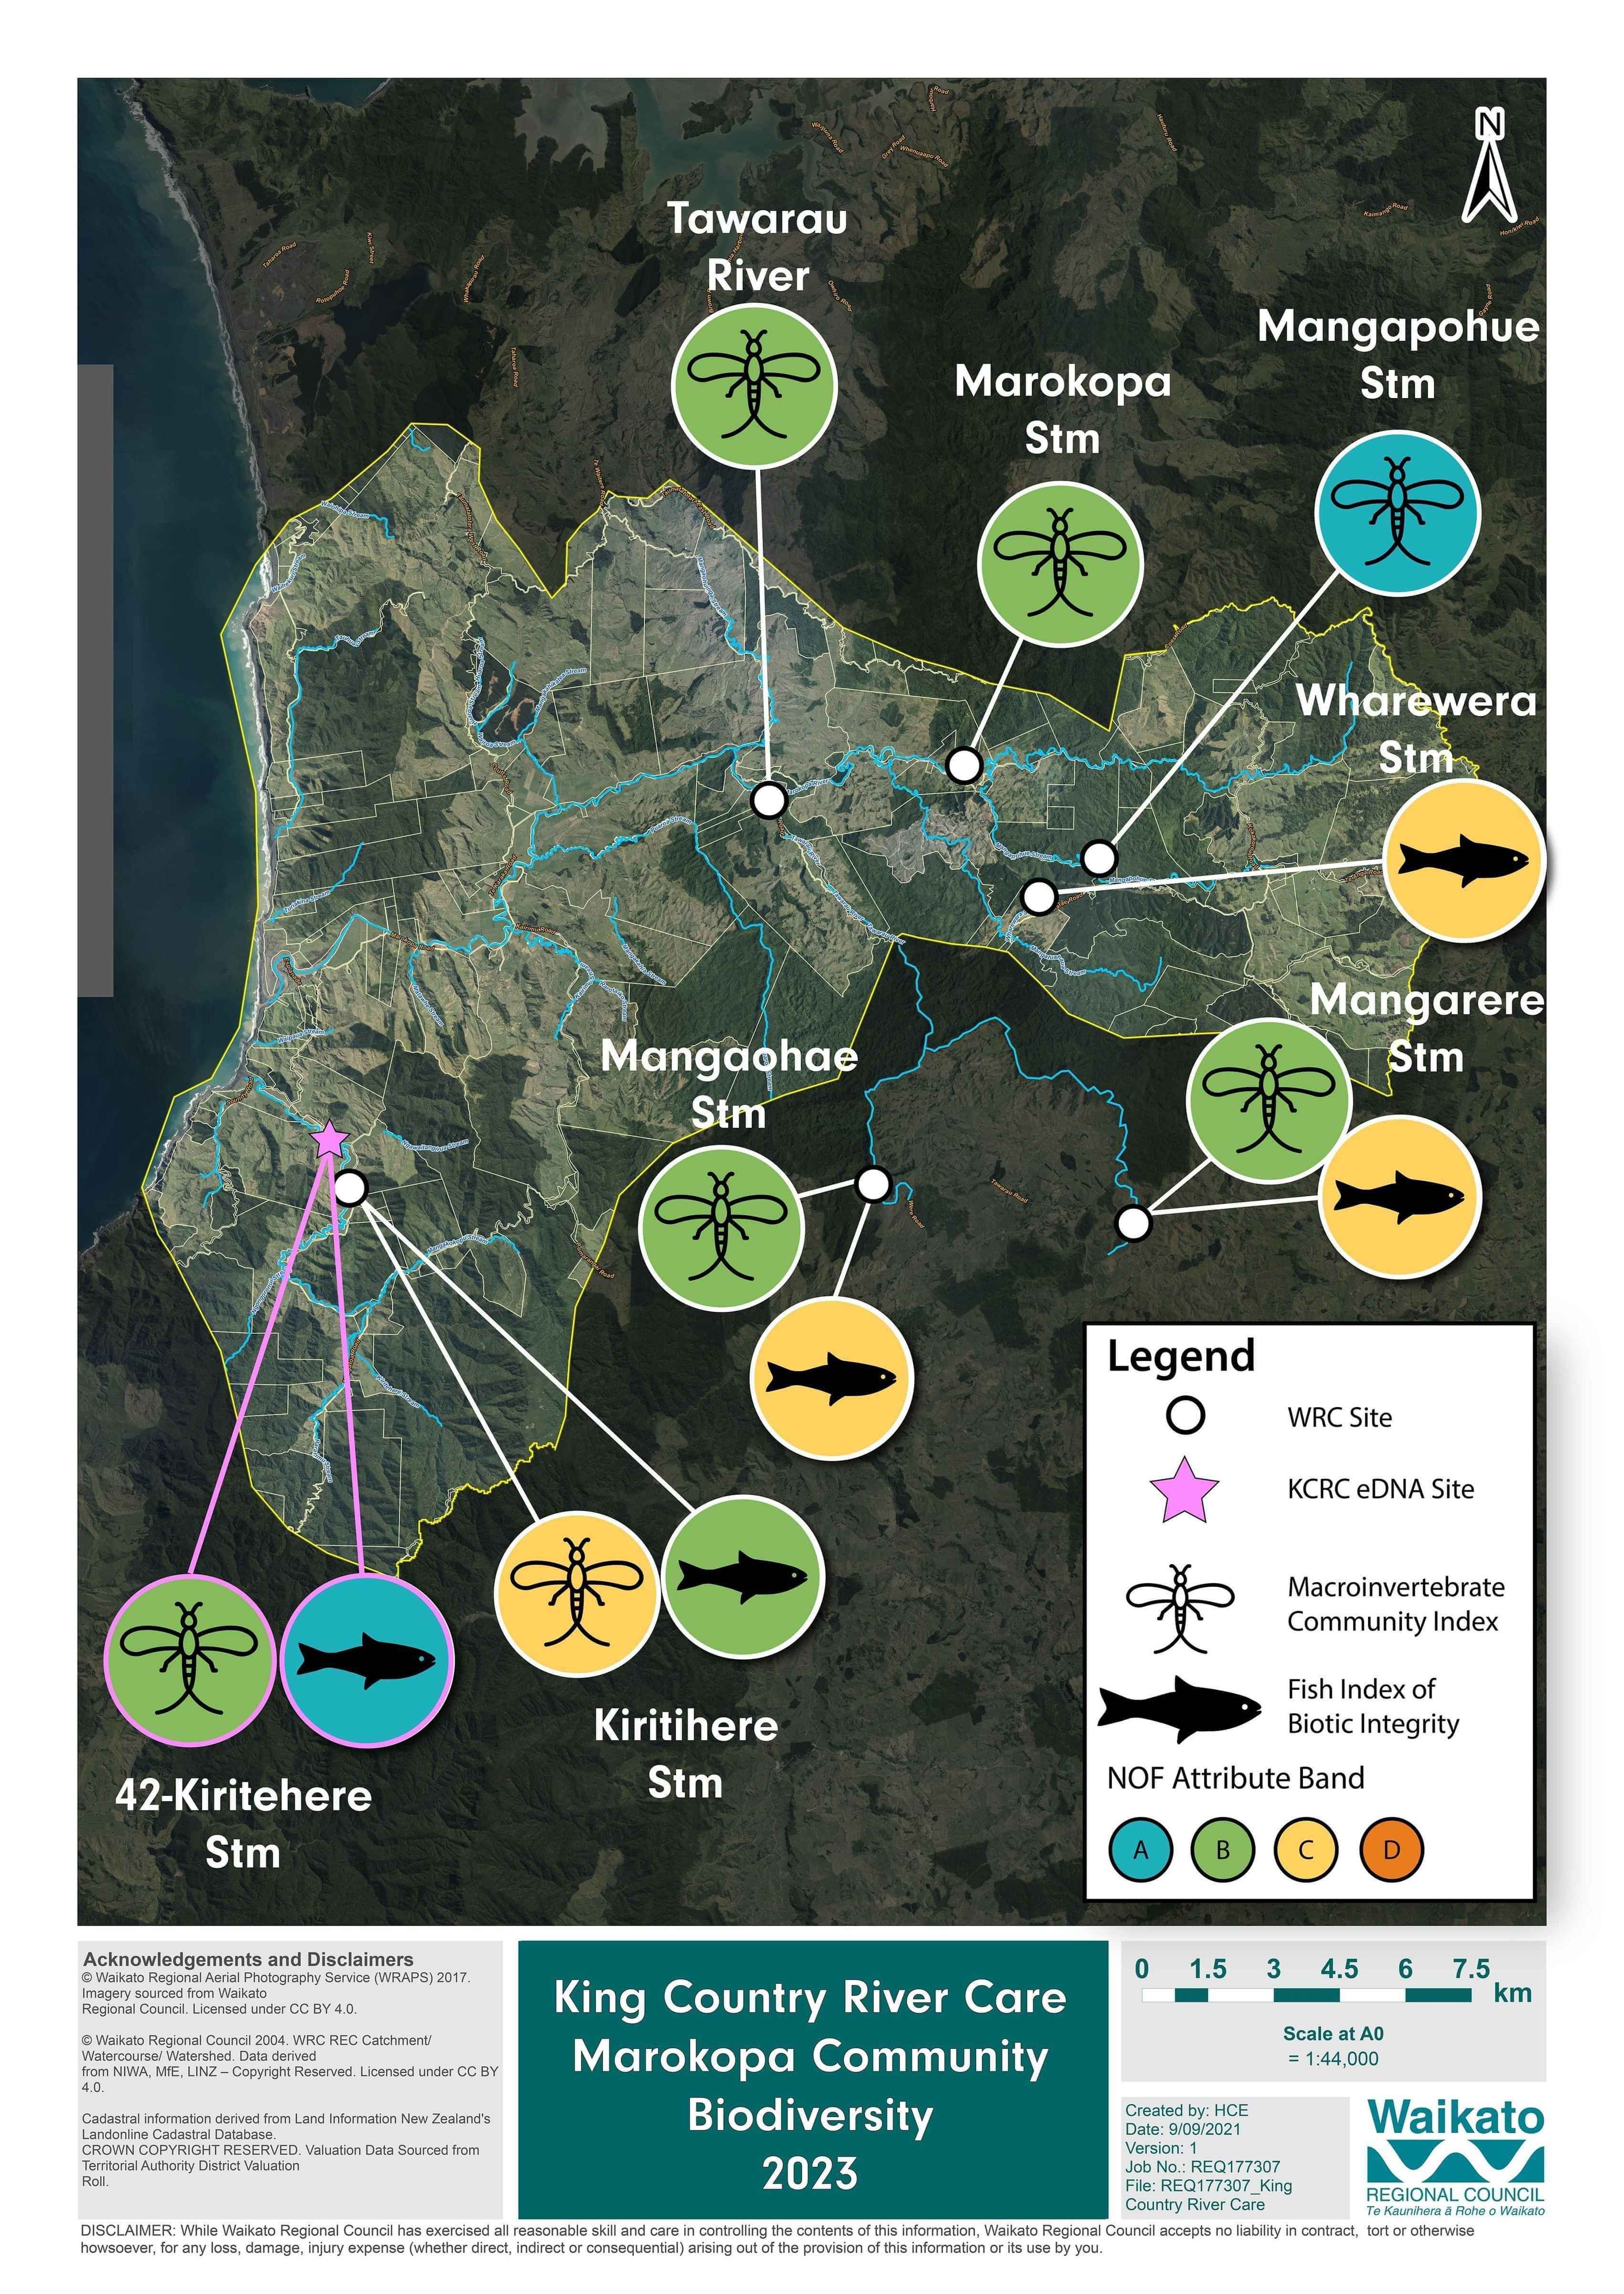
Aquatic Biodiversity Summary
Biodiversity monitoring includes eDNA, collected by KCRC, and traditional biodiversity monitoring techniques (netting of freshwater invertebrates and netting and electrofishing of freshwater fish), by Waikato Regional Council (WRC). eDNA sampling has been done by KCRC, in autumn and winter in 2021, 2022 and 2023. WRC monitors most sites every 1 to 2 years, between November and March. If more than one results is available for any single monitoring location the results for that site are averaged across years.
Marokopa river had good ecological health indicators, however, there is low fish diversity in the mid to upper catchment, above the waterfall. The fish community above the waterfall is dominated by eels only.
Marokopa waterfall is 35 meters high, it is a cascading water so although it is considered a significant barrier to fish migration some native kōkopu species, koaro and eels would likely be able to traverse it.
The fish community was diverse in Kiritehere stream, suggesting the same would be true in Marokopa river, downstream of the waterfall.
Seven species of threatened fish were detected via eDNA in Kiritehere stream, including lamprey, Īnanga, Giant kōkopu, Shortfin kōkopu, Longfin eel, Redfin bully and Torrentfish.
Only 1 species of introduced fish was detected across the whole catchment, brown trout.
Invertebrate MCI was good at all monitoring sites, suggesting there is good habitat at these locations.
The number of insect species at Kiritehere stream is moderate at 25.