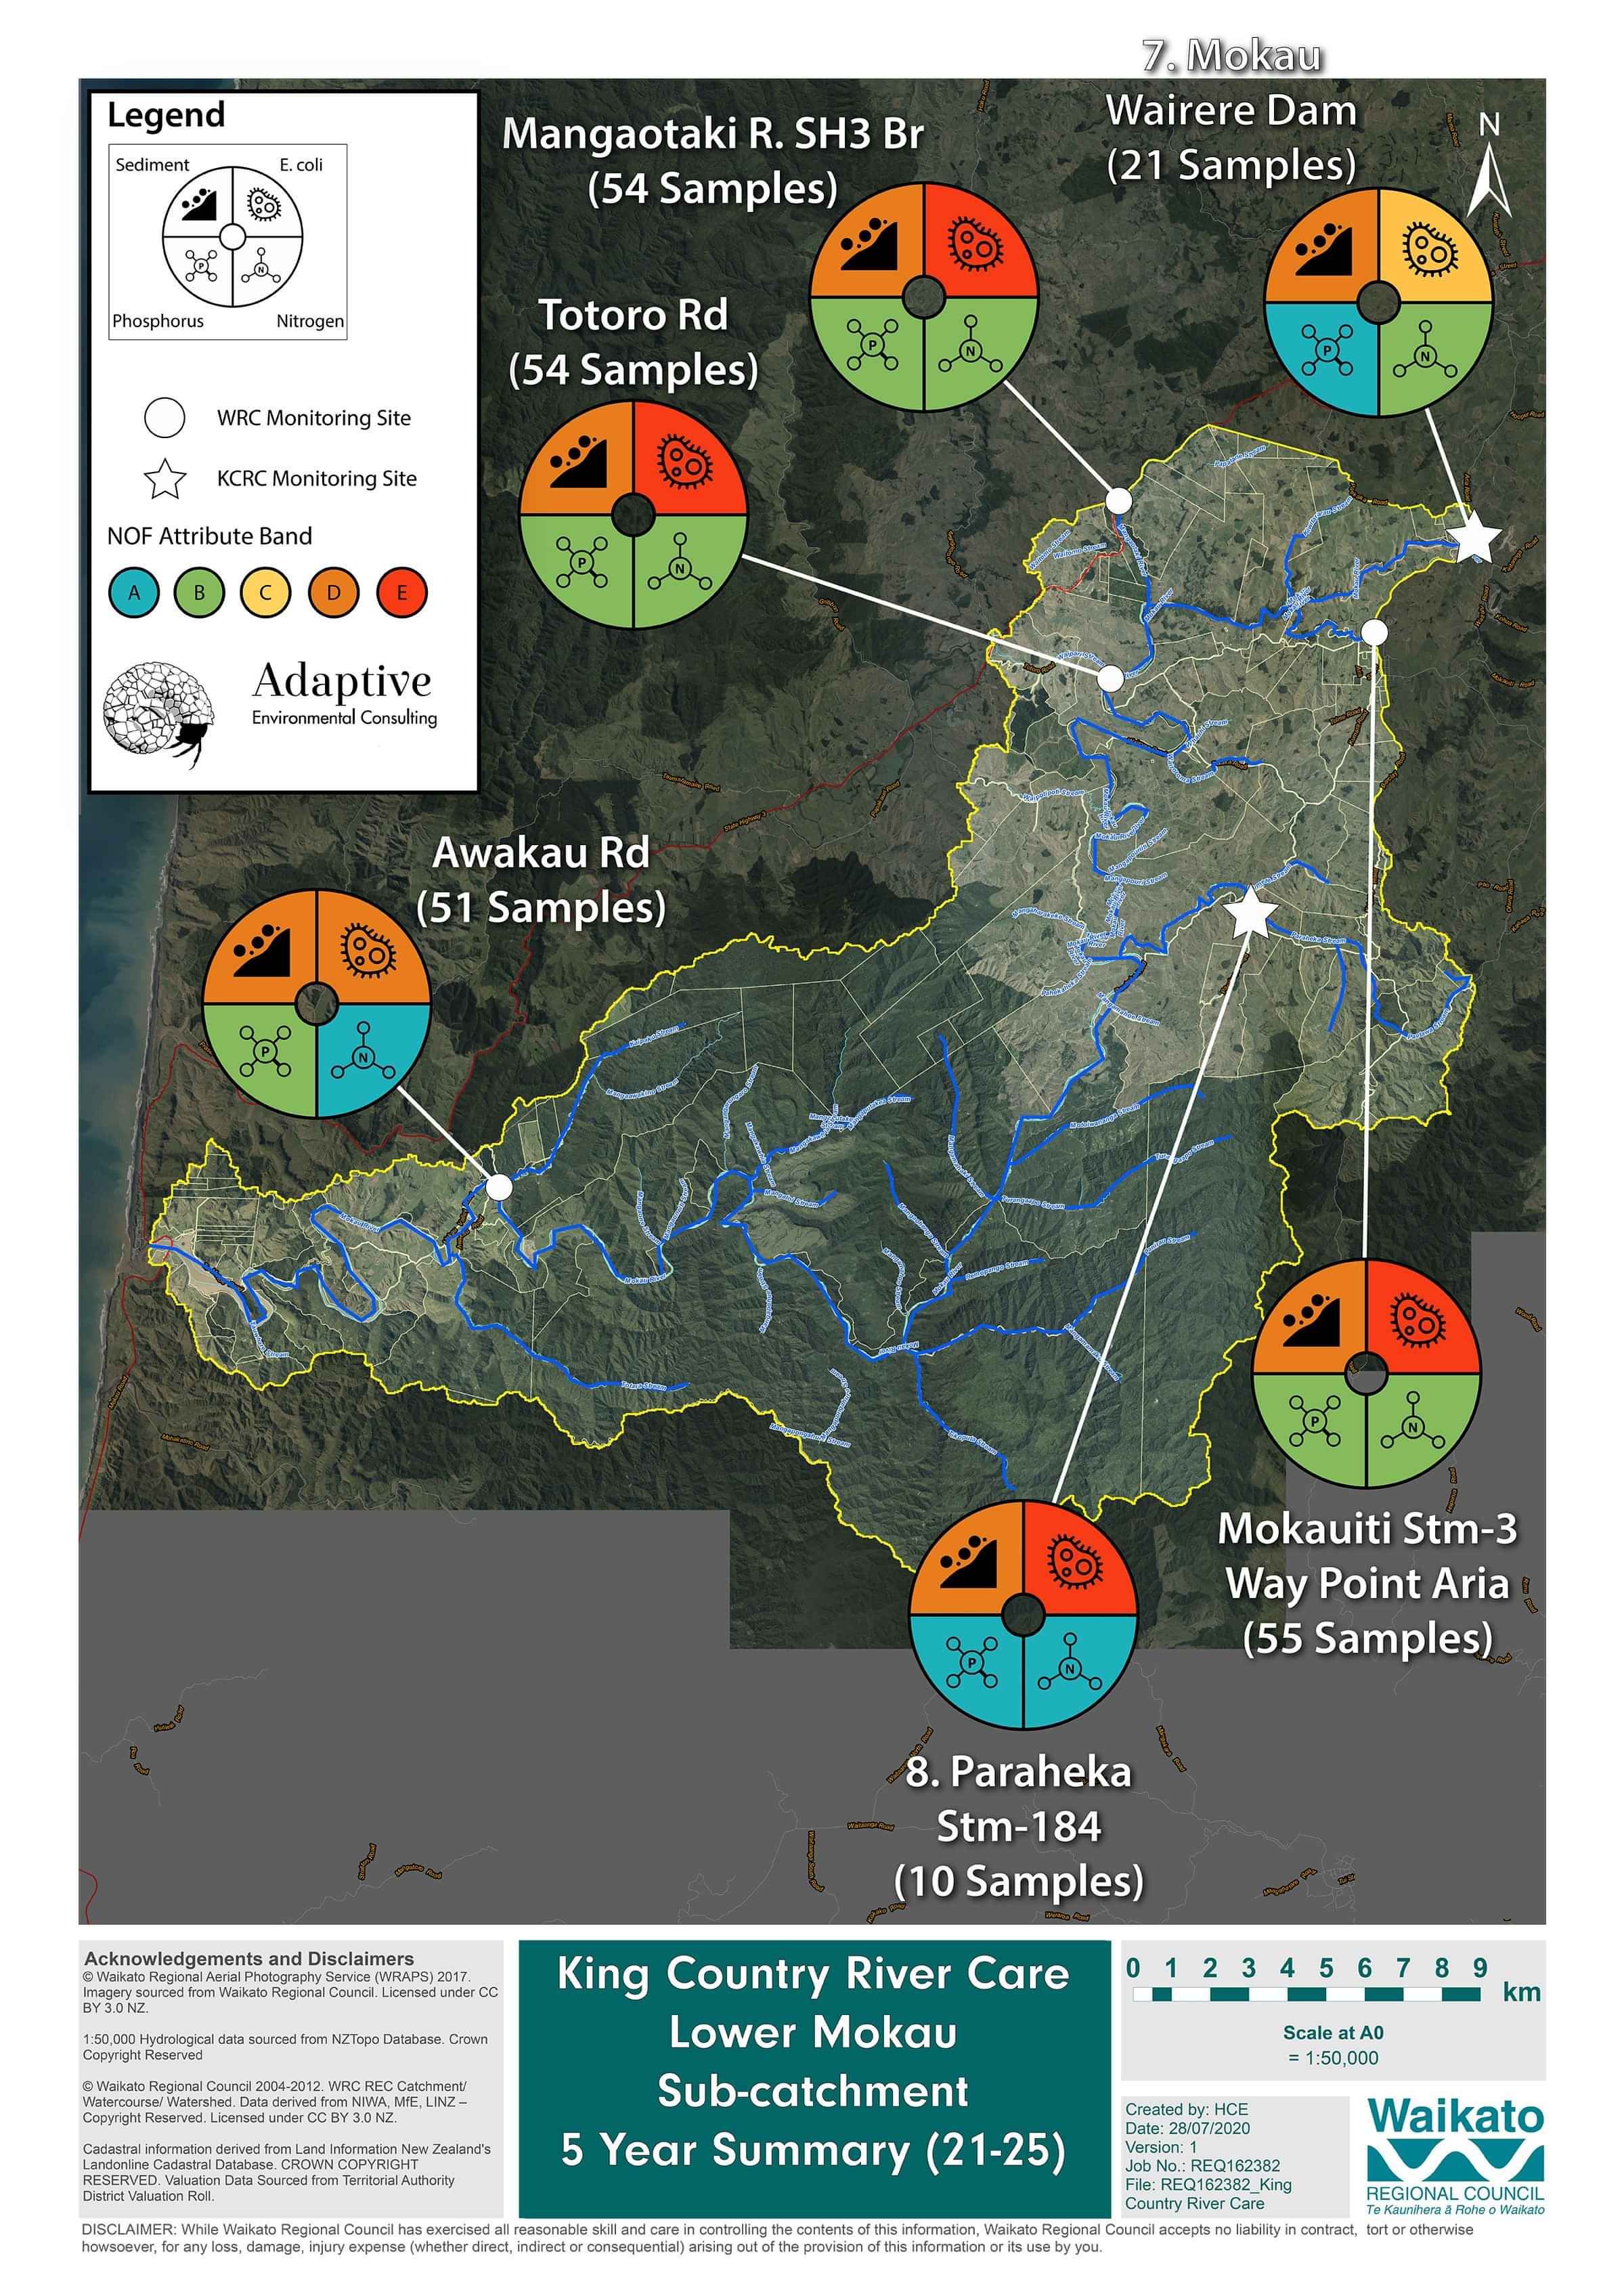
Lower Mokau
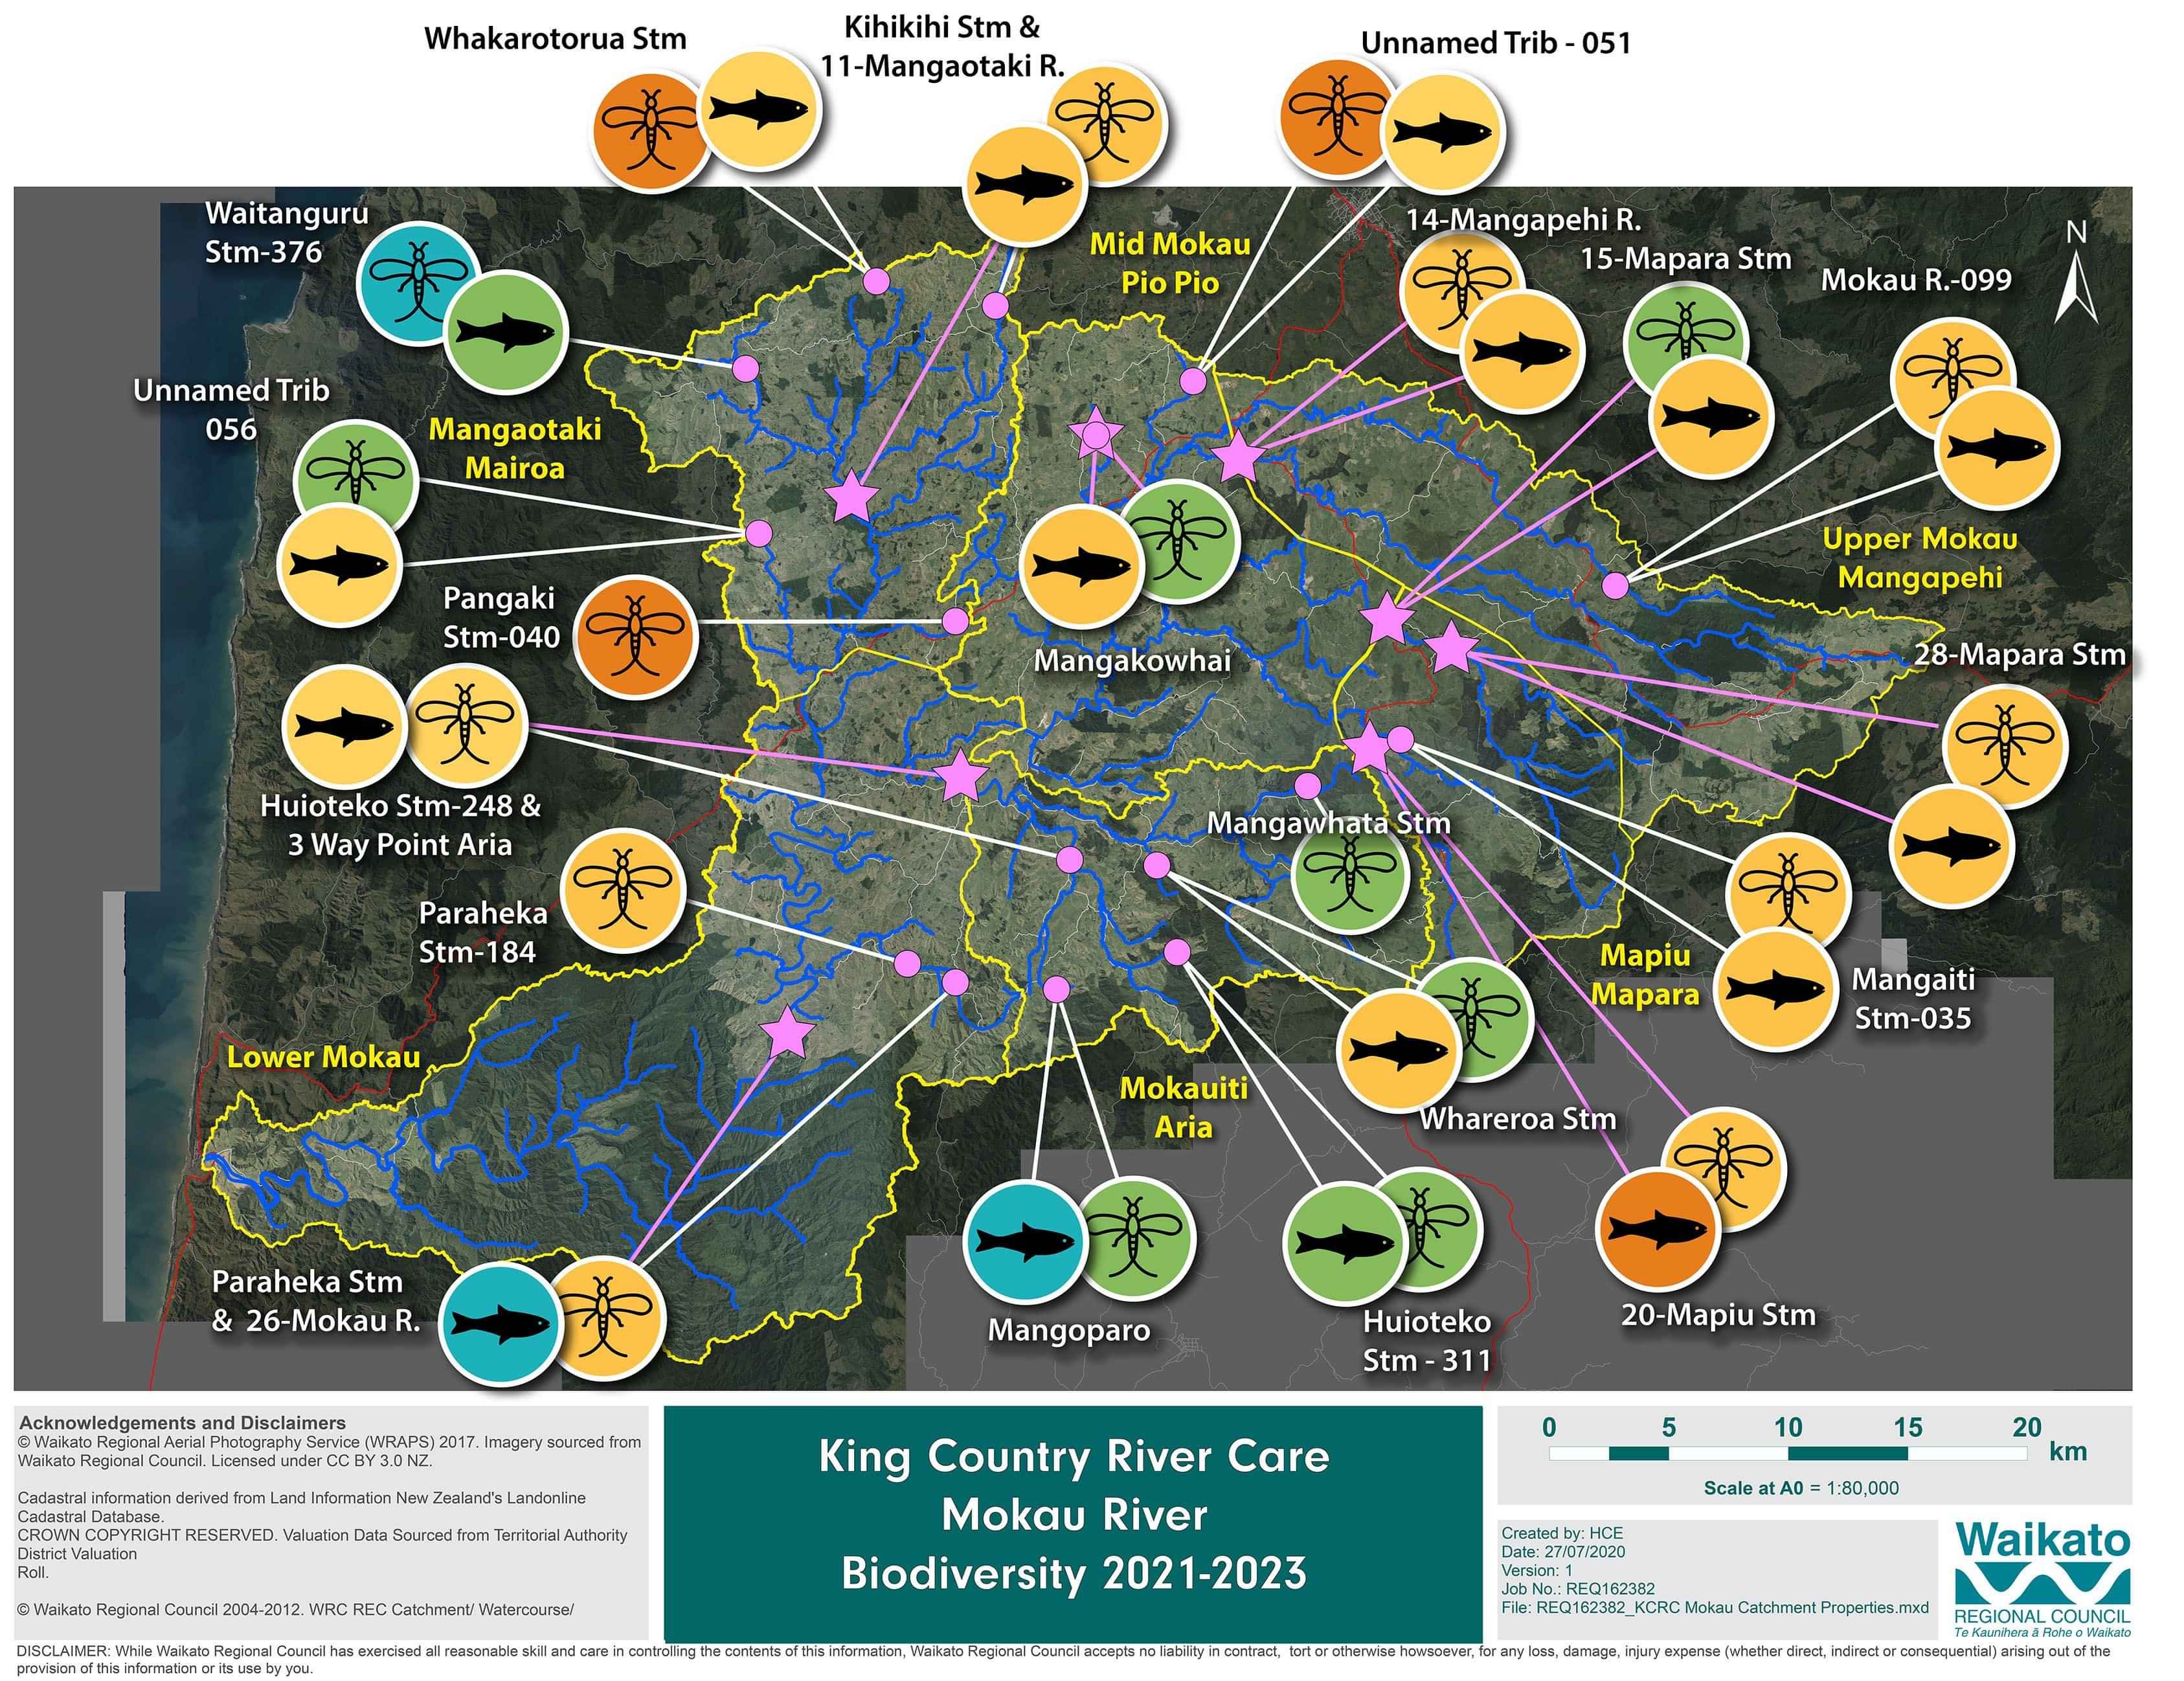
Catchment monitoring by King Country River Care, commenced in 2021. Across the entire Mokau River catchment the monitoring programme covers up to 16 monitoring sites across 6 sub-catchments sampled on a quarterly basis.
Waikato Regional Council (WRC) has 5 monitoring sites in 4 of these 6 sub-catchments, which are monitored monthly.
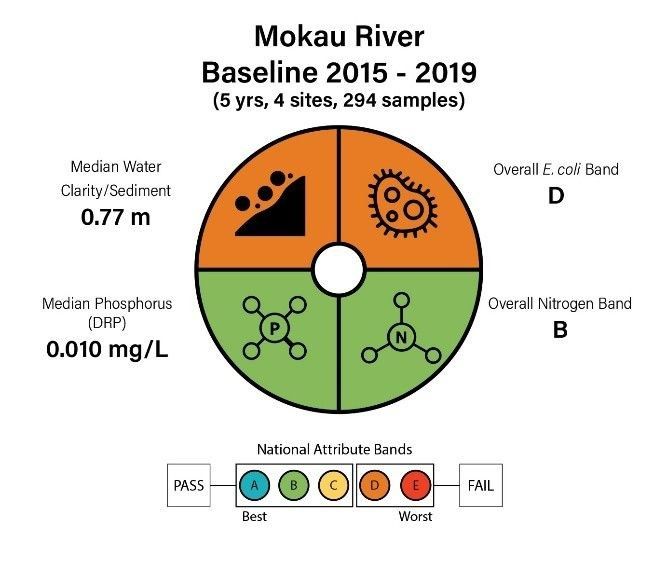
A water quality baseline was calculated from the time the catchment group was formed using five years (Jan 2015 – Dec 2019) of monthly monitoring data, collected at the WRC sites.
The location of the monitoring sites for each sub-catchment are shown on the right.
Key Resources Being Lost from the Land
Monitoring across five sites in 2025 shows that the key resources lost from the Lower Mokau sub-catchment were E. coli and Sediment (reflected by low water clarity). E. coli was elevated at four sites and slightly elevated above the Wairere Dam. Sediment loss was elevated at three sites and slightly elevated at Mangaotaki River, State Highway 3 bridge.
Elevated E. coli represents a loss of organic matter and nutrients as it is largely associated with animal manure in rural catchments.
Loss of Sediment represents a loss of soil and nutrients.
Catchment Hotspots
E. coli: Elevated at all sites but the Wairere Dam, which was still slightly elevated – Only Wairere Dam met national health guidelines for swimming. In descending order, concentrations were highest at Mokauiti Stream - 3 way point Aria, Totoro Rd, Mangaotaki River, and lowest in the Mokau River at Wairere Dam.
Sediment: Suspended sediment was high at three sites. The highest levels were in Mokauiti Stream; the lowest levels were at Awakau Rd.
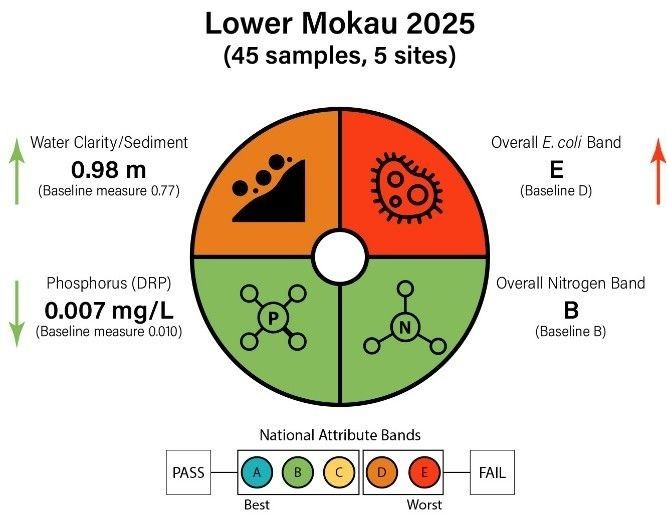
The water quality dials summarise the results collected from the sites in the Lower Mokau catchment. The dial on the left shows the baseline for the catchment, covering 5 years of regional council monitoring at the five WRC monitoring sites (Awakau Road, Mokauiti Stream at 3-way Point Aria, Mangaotaki River-SH3 bridge, Totoro Road and Mangaokewa Road off SH30). The dial on the right combines all data collected at 5 sites in 2025, 45 samples in total. Arrows indicate either an increase or decrease in values compared to the sub-catchment baseline. An increase in water clarity is positive for river health while an increase in all other indicators may impair river health.
In 2025, nutrient indicators met national water quality limits, while water clarity/suspended sediment and E. coli did not. Compared to the baseline – Water clarity was higher and E. coli was greater. Conversely, dissolved reactive phosphorus was less while Nitrogen was the same as the baseline levels.
2025 Quarterly Summaries
August 2025
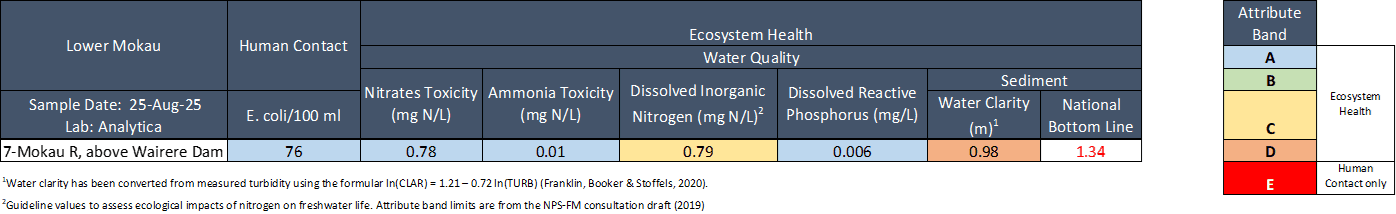
Water quality was Fair in the Lower Mokau river (Site 7).
E. coli concentrations were very low (76 cells per 100 mL), meeting both the health guidelines for swimming (540 cells per 100 mL) and guidelines for livestock drinking water (< 100 cells per 100 mL).
Nitrogen: Nitrate was slightly elevated (0.78 mg/L) but fell well below the ecological toxicity levels (2.4 mg/L). Ammonia was low (0.01 mg/L). Dissolved inorganic nitrogen (DIN) was slightly elevated (0.79 mg/L), falling above the ecological impact threshold (0.5 mg/L).
Phosphorus: Dissolved reactive phosphorus (DRP) was very low (0.006 mg/L).
Suspended sediment/Water Clarity: Water clarity was Poor (0.98 m), relative to the national bottom line (1.34 m).
The results in the table below have been graded according to the National Policy Statement for Freshwater Management (NPS-FM, 2020).
Sample Collection Day: 25th August 2024
Mokau River – Summary of water quality collected from 15 sites across the Mokau River catchment on 25th August 2025
Water quality was Fair across the Mokau River Catchment. While most sites had low to moderate levels of E. coli and phosphorus, 80% of all sites had poor water clarity and exceeded the ecological threshold for dissolved inorganic nitrogen.
E. coli (Microbial Contamination):
Most sites (73%) had low concentrations (≤ 240 cells per 100 mL), a low risk for swimming.
Three sites (20%) had very low concentrations (< 100), considered safe for livestock drinking water[1].
Four sites (27%) had slightly elevated concentrations (280 - 460 cells per 100 mL).
Nitrogen
Nitrate:
Three sites (20%) had low concentrations (≤ 0.5 mg/L).
Twelve sites (80%) exceeded ecological impact thresholds (0.5 mg/L), which can affect stream health.
All sites fell well below ecological toxicity thresholds (2.4 mg/L) for native fish and invertebrates.Ammonia:
Most sites had low concentrations (<0.005 - 0.03 mg/L), of little concern for aquatic life.
One site (Huioteko stream) had slightly elevated concentrations (0.15 mg/L), which can impact sensitive aquatic species.Dissolved Inorganic Nitrogen (DIN):
Three sites (20%) had low concentrations (≤ 0.50 mg/L).
10 sites (67%) were slightly elevated (0.51 – 1.0 mg/L), exceeding the ecological impact threshold of (0.5 mg/L).
Two sites (13%) had concentrations exceeding 1 mg/L, which is of particular concern for aquatic life.
Phosphorus
Dissolved Reactive Phosphorus (DRP):
Most sites (93%) had low levels (<0.002 - 0.009 mg/L).
One site (Waitanguru) was slightly elevated (0.012 mg/L), which can contribute to problematic plant and algae growth if levels stay high.
Suspended Sediment / Water Clarity:
Three sites (20%) had Excellent water clarity (A band).
One site (Waitanguru stream) had Fair water clarity (C band).
Nearly three quarters of all sites (73%) had Poor water clarity (D band).
Water clarity bands for each site are based on the National Bottom Line (NBL), which varies depending on local landscape characteristics (e.g. geology, climate, and elevation). For Mokau River sites, the NBL is either 1.34 m or 0.61 m, depending on location.
[1] Drinking water for livestock should contain < 100 cfu/100 mL (median value) of E. coli. Livestock Drinking Water Guidelines (2023), Australian & New Zealand Guidelines for Fresh & Marine Water Quality.
2025 Quarterly Summaries
November 2025
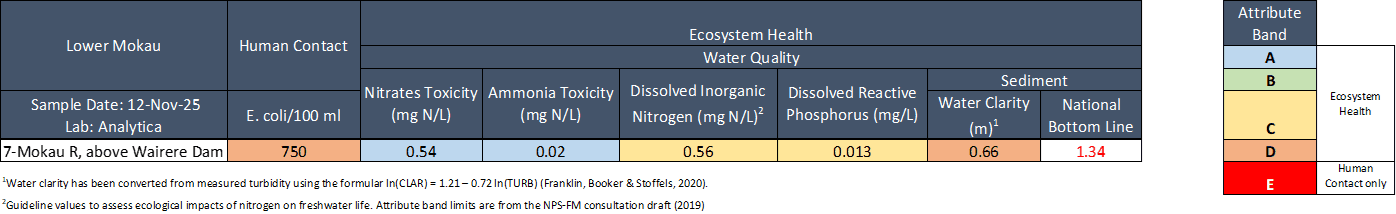
Water quality was Poor in the Lower Mokau river (Site 7).
E. coli concentrations were elevated (750 cells per 100 mL), exceeding both the health guidelines for swimming (540 cells per 100 mL) and guidelines for livestock drinking water (< 100 cells per 100 mL).
Nitrogen: Nitrate was slightly elevated (0.54 mg/L) but fell well below the ecological toxicity levels (2.4 mg/L). Ammonia was low (0.02 mg/L). Dissolved inorganic nitrogen (DIN) was slightly elevated (0.56 mg/L), falling above the ecological impact threshold (0.5 mg/L).
Phosphorus: Dissolved reactive phosphorus (DRP) was slightly elevated (0.013 mg/L).
Suspended sediment: Water clarity was Poor (0.66 m), relative to the national bottom line (1.34 m).
The results in the table below have been graded according to the National Policy Statement for Freshwater Management (NPS-FM, 2020).
Sample Collection Day: 12th November 2025
Mokau River – Summary of water quality collected from 15 sites across the Mokau River catchment on 12th November 2025
Water quality was Fair across the Mokau River Catchment. While most sites had low to moderate levels of nitrogen and phosphorus, 73% of all sites had poor water clarity and 60% had elevated E. coli concentrations. The sites with the best water quality in the Mokau River catchment were Whareroa stream, Ramaroa stream, and Waitanguru stream.
E. coli (Microbial Contamination):
Three sites (20%) had low concentrations (≤ 190 cells per 100 mL), a low risk for swimming.
Two sites had very low concentrations (< 100), considered safe for livestock drinking water[1].
Another three sites (20%) had slightly elevated concentrations (350 - 400 cells per 100 mL)
Just under two thirds of sites (60%) had very high concentrations (610 – 2,200), which exceeded recommended levels for swimming.
Nitrogen
Nitrate:
Two thirds of sites (67%) had low concentrations (≤ 0.48 mg/L) and a third of sites exceeded this ecological impact threshold (> 0.5 mg/L), which may affect stream health.
All sites fell well below ecological toxicity thresholds (2.4 mg/L) for native fish and invertebrates.Ammonia:
Most sites had low concentrations (<0.005 - 0.03 mg/L), of little concern for aquatic life.
Two sites had slightly elevated concentrations (> 0.03 mg/L), which can impact sensitive aquatic species.Dissolved Inorganic Nitrogen (DIN):
Two thirds of sites (67%) had low concentrations (≤ 0.50 mg/L).
The other third had slightly elevated concentrations (0.53 – 0.77 mg/L), exceeding the ecological impact threshold of 0.5 mg/L.
Phosphorus
Dissolved Reactive Phosphorus (DRP):
Two thirds of sites (67%) had low concentrations (0.003 - 0.01 mg/L).
The other third of sites had slightly elevated concentrations (0.011 – 0.013 mg/L), which can contribute to problematic plant and algae growth if levels stay high.
Suspended Sediment / Water Clarity:
Three sites (20%) had Excellent water clarity (A band).
One site had Fair water clarity (C band).
Nearly three quarters of all sites (73%) had Poor water clarity (D band).
Water clarity bands for each site are based on the National Bottom Line (NBL), which varies depending on local landscape characteristics (e.g. geology, climate, and elevation). For Mokau River sites, the NBL is either 1.34 m or 0.61 m, depending on location.
[1] Drinking water for livestock should contain < 100 cfu/100 mL (median value) of E. coli. Livestock Drinking Water Guidelines (2023), Australian & New Zealand Guidelines for Fresh & Marine Water Quality.
2025 Quarterly Summaries
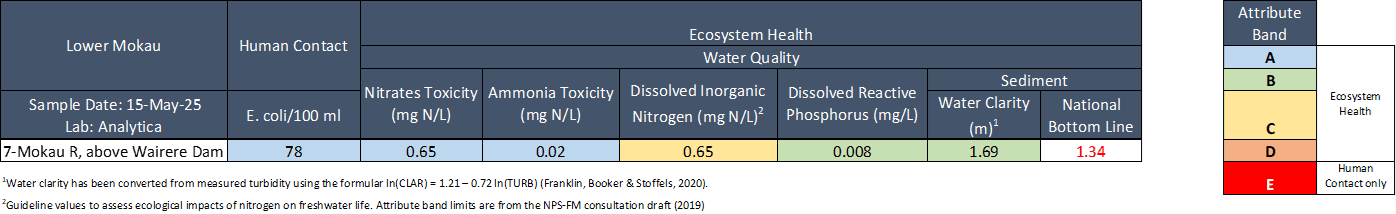
May 2025
Water quality was Good in the Lower Mokau river (Site 7).
E. coli concentrations were very low (78 cells per 100 mL), falling well below health guidelines for swimming (540 cells per 100 mL) and guidelines for livestock drinking water (< 100 cells per 100 mL).
Nitrogen: Nitrate concentrations were slightly elevated (0.65 mg/L) but fell well below ecological toxicity levels (2.4 mg/L). Ammonia concentrations were low (0.02 mg/L). Dissolved inorganic nitrogen (DIN) was slightly elevated (0.65 mg/L), falling above the ecological impact threshold (0.5 mg/L).
Phosphorus: Dissolved reactive phosphorus (DRP) was low (0.008 mg/L).
Suspended sediment/Water Clarity: Water clarity was Excellent (1.69 m), relative to the national bottom line (1.34 m).
The results in the table below have been graded according to the National Policy Statement for Freshwater Management (NPS-FM, 2020)..
Collection date: 15th May 2025
Mokau River – Summary of water quality collected from 15 sites across the Mokau River catchment on 15th May 2025
Water quality was Fair across the Mokau River Catchment. While most sites had low to moderate levels of E. coli, nitrogen, and phosphorus, and water clarity was good at over half the locations, a few sites exceeded ecological thresholds for nutrients and water clarity.
E. coli (Microbial Contamination):
Most sites (60%) had low concentrations (≤ 230 cells per 100 mL) low risk for swimming.
Two sites (13%) had very low concentrations (< 100), considered safe for livestock drinking water[1].
A third of sites (33%) had slightly elevated concentrations (370 - 490 cells per 100 mL).
One site (Puputaha stream) had high levels (690 cells per 100 mL) which could pose a health risk, especially when swimming.
Nitrogen
Nitrate:
All 15 sites had low to moderate concentrations (0.06 - 0.80 mg/L), falling well below ecological toxicity thresholds (2.4 mg/L) for native fish and invertebrates.
However, 4 sites exceeded ecological impact thresholds (0.5 mg/L), which can affect stream health.Ammonia:
All sites had very low concentrations (<0.005 - 0.08 mg/L), little concern for aquatic life.Dissolved Inorganic Nitrogen (DIN):
Most sites (73%) had low concentrations (≤ 0.46 mg/L).
Four sites (27%) were slightly elevated (0.63 - 0.80 mg/L), exceeding the ecological impact threshold of (0.5 mg/L).
Phosphorus
Dissolved Reactive Phosphorus (DRP):
Two-thirds of sites (67%) had low levels (<0.002 - 0.009 mg/L).
Five sites (33%) were slightly elevated (0.011 – 0.014 mg/L) which can contribute to problematic plant and algae growth if levels stay high.
Suspended Sediment / Water Clarity:
Over half of sites (53%) had Good water clarity (A or B band).
Two sites (13%) had Fair water clarity (C band).
A third of sites (33%) had Poor water clarity (D band).
Water clarity bands for each site are based on the National Bottom Line (NBL), which varies depending on local landscape characteristics (e.g. geology, climate, and elevation). For Mokau River sites, the NBL is either 1.34 m or 0.61 m, depending on location.
[1] Drinking water for livestock should contain < 100 cfu/100 mL (median value) of E. coli. Livestock Drinking Water Guidelines (2023), Australian & New Zealand Guidelines for Fresh & Marine Water Quality.
2025 Quarterly Summaries
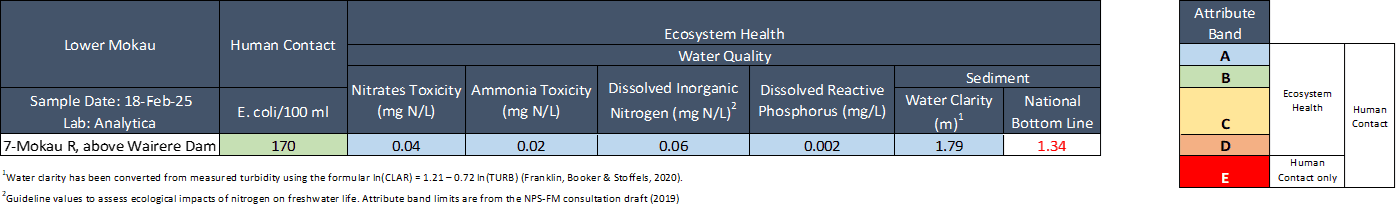
February 2025
Water quality was Excellent in the Lower Mokau river (Site 7).
E. coli concentrations were low (170 cells per 100 mL), falling well below recommended health guidelines for swimming (540 cells per 100 mL).
Nitrogen: Nitrate concentrations were very low (0.04 mg/L), falling well below ecological toxicity levels (2.4 mg/L). Ammonia concentrations were low (0.02 mg/L). Dissolved inorganic nitrogen (DIN) was very low (0.06 mg/L), falling well below the ecological impact threshold (0.5 mg/L).
Phosphorus: Dissolved reactive phosphorus (DRP) was also very low (0.002 mg/L).
Suspended sediment/Water Clarity: Water clarity was excellent (1.79 m), relative to the national bottom line (1.34 m).
The results in the table below have been graded according to the National Policy Statement for Freshwater Management (NPS-FM, 2020).
Collection date: 18th February 2025
Mokau River – Summary of water quality collected from 15 sites across the Mokau River catchment on 18th February 2025
Most sites had low nutrient levels, but elevated E. coli and poor water clarity were common, with a few locations exceeding human health and ecological health thresholds.
E. coli: 60% of sites had elevated concentrations (between 890 and 3,100 cells per 100 mL), 20% (3 sites) had slightly elevated concentrations (between 300 and 500), and 20% had low concentrations (≤ 170).
Nitrogen: Nitrate: 100% of sites had low concentrations (range = 0.001 to 0.56 mg/L).
Ammonia: 100% of sites were low to moderate (range = <0.005 to 0.200 mg/L). Dissolved Inorganic Nitrogen (DIN): 93% of sites had low concentrations (≤ 0.50 mg/L), and 7% (1 site) was slightly elevated (0.58 mg/L), exceeding the ecological impact threshold of 0.5 mg/L.
Phosphorus: Dissolved Reactive Phosphorus (DRP): 80% of sites had low concentrations (between <0.002 and 0.009 mg/L), 13% (2 sites) were slightly elevated (0.011 – 0.012 mg/L), and 7% (1 site) returned a very high concentration (0.024 mg/L).
Suspended Sediment / Water Clarity: 47% of sites had good water clarity (A or B band), 7% (1 site) had fair water clarity (C band), and the remaining 47% had poor water clarity (D band). Bands for each site relate to the National Bottom Line (NBL) for water clarity and depend on landscape characteristics including geology, climate, and elevation. The NBL for Mokau River monitoring sites is either 1.34 m or 0.61 m, depending on local landscape characteristics.
Lower Mokau
Data & Downloads
->
Aquatic Biodiversity Summary
Biodiversity monitoring includes eDNA, collected by KCRC, and traditional biodiversity monitoring techniques (netting of freshwater invertebrates and netting and electrofishing of freshwater fish), by Waikato Regional Council (WRC). eDNA sampling has been done by KCRC, in autumn and winter in 2021, 2022 and 2023. WRC monitors most sites every 1 to 2 years, between November and March. If more than one results is available for any single monitoring location the results for that site are averaged across years.